Real PVGIS Irradiance Data, Not a Yearly Rule-of-Thumb
The simulation combines the installation's configuration (orientation, tilt angle, power, any multiple roof planes) with historical solar irradiance from PVGIS — the European Commission's reference service for solar energy — to calculate a realistic production series, quarter-hour by quarter-hour.
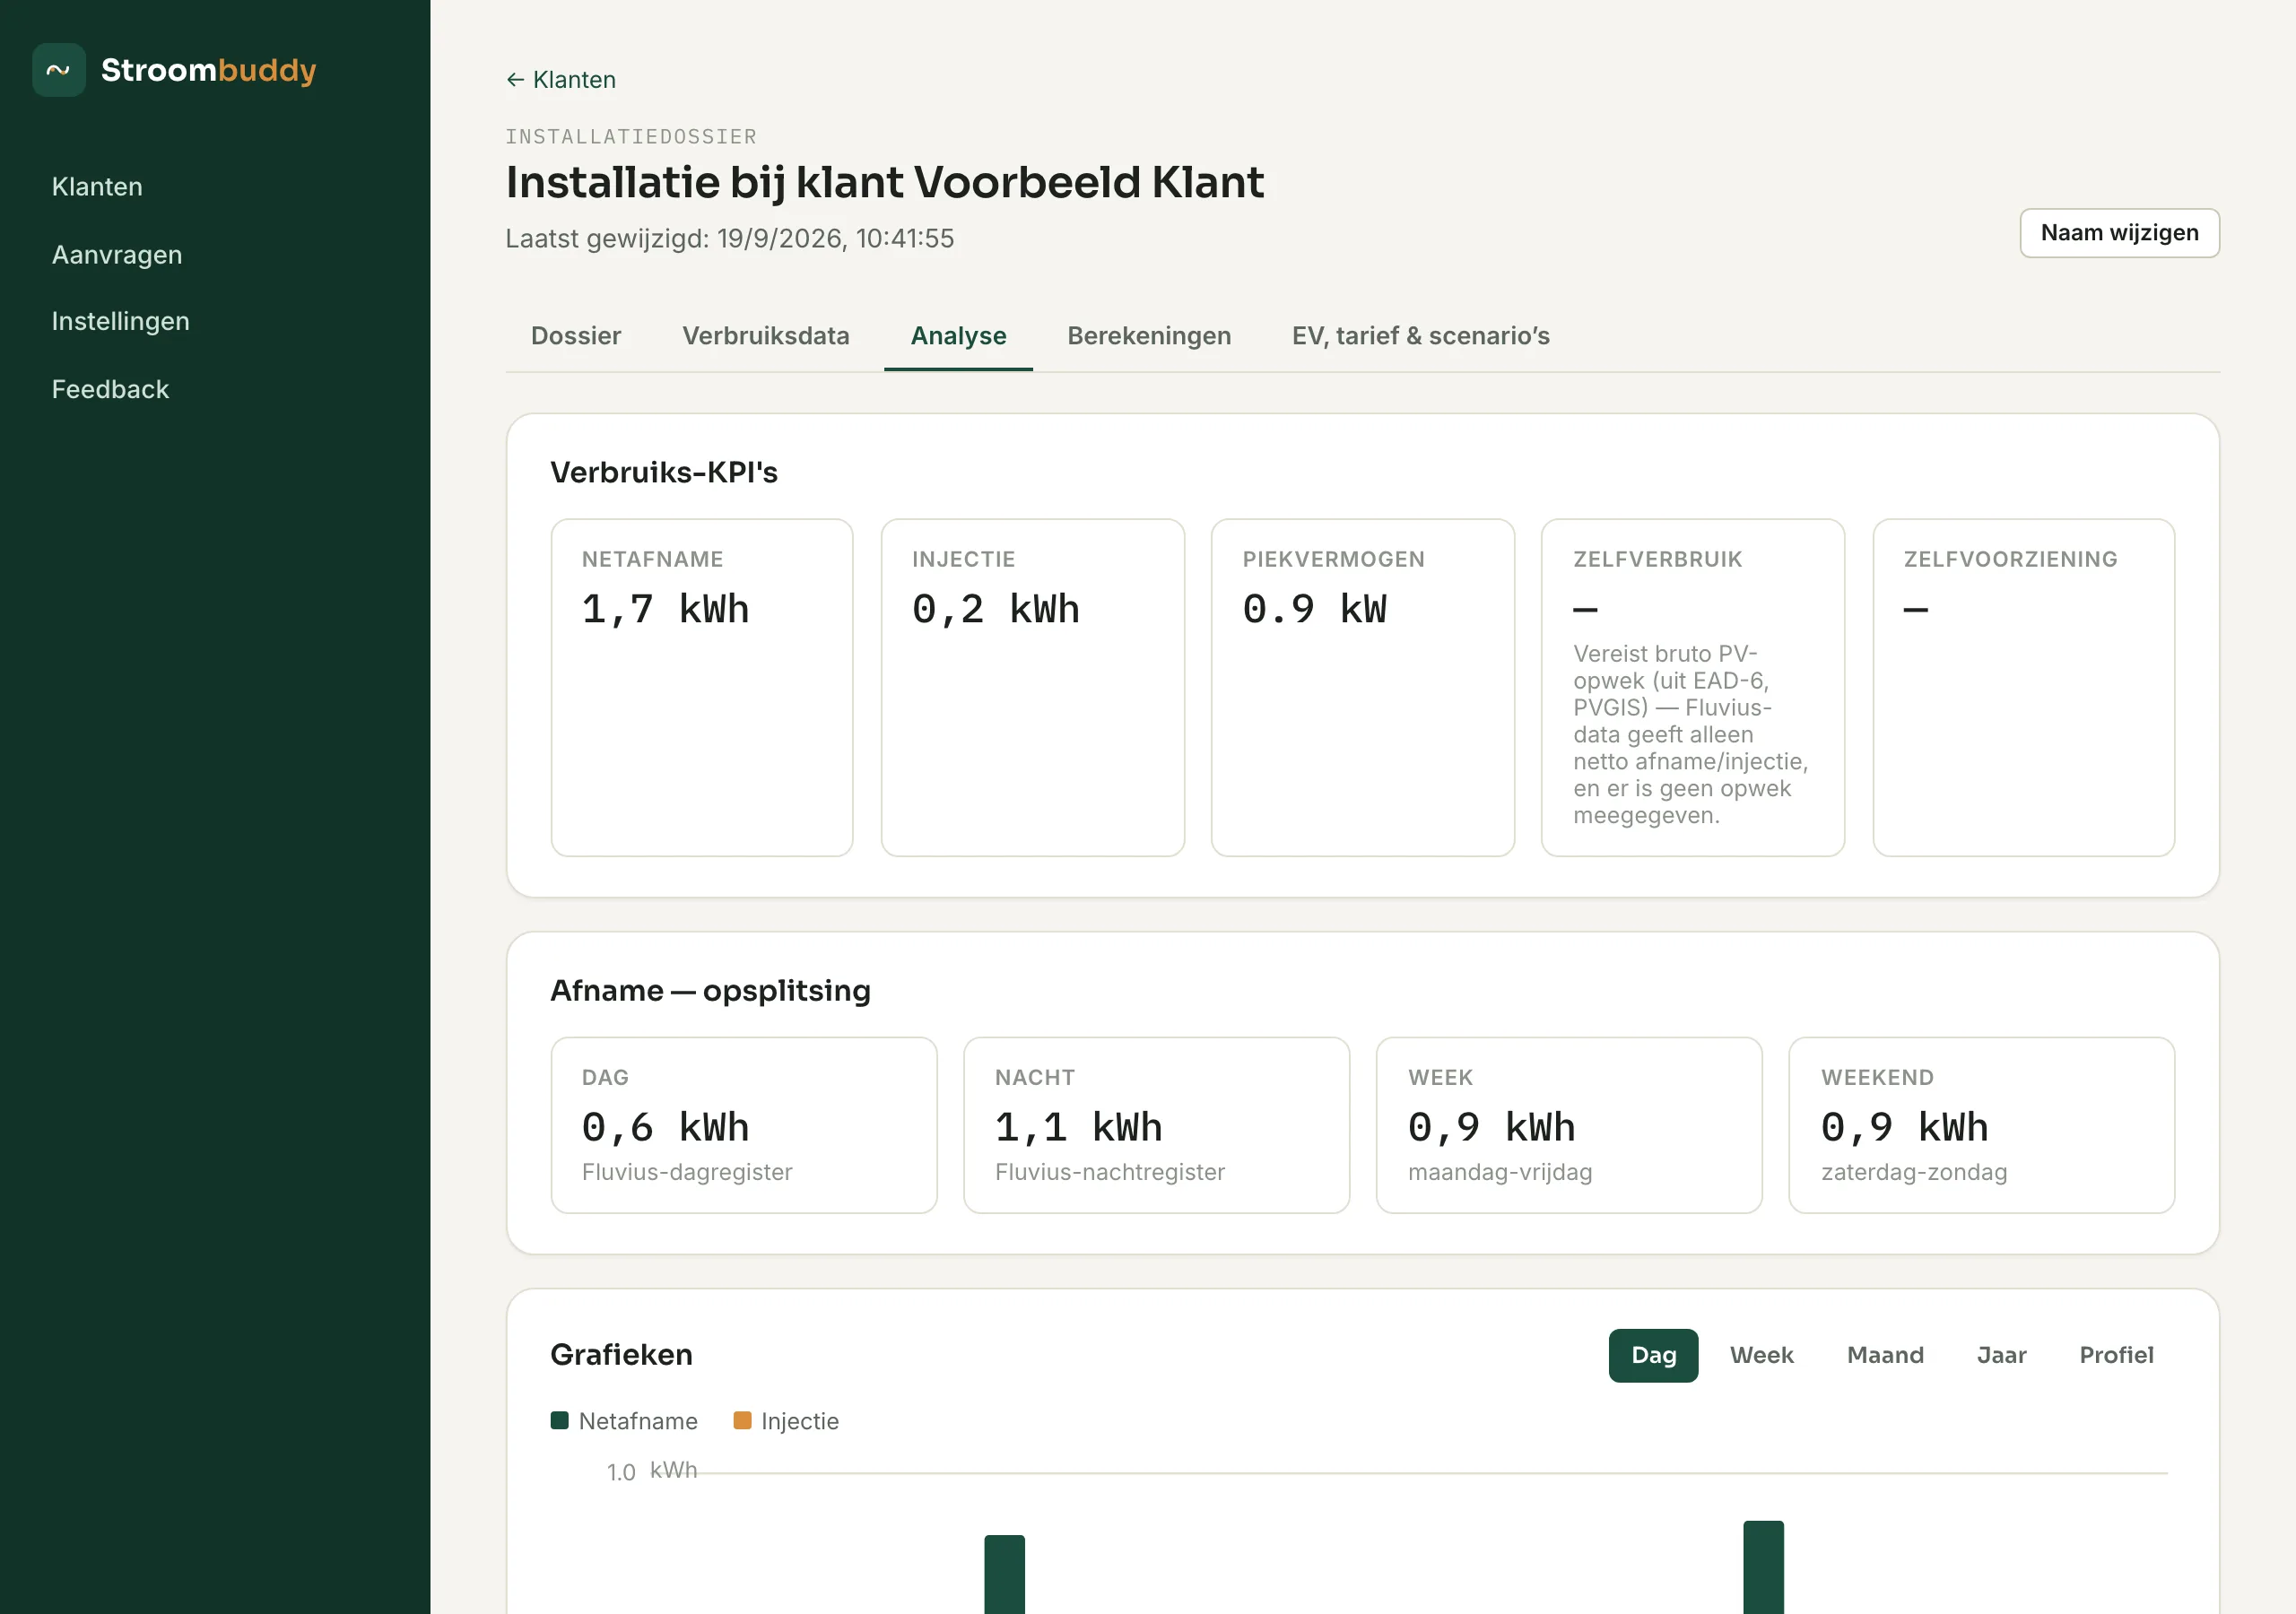
Self-Consumption and Self-Sufficiency, Calculated from Real Usage
By matching the PV production series against the client's real measured usage (for example via Fluvius), it becomes clear exactly how much of the client's own generation is actually self-consumed (self-consumption) and what share of usage is covered by PV (self-sufficiency) — figures a client needs to evaluate an investment.
Curtailment Factored into Every Payback Calculation
Where relevant, curtailment is also taken into account — the power limit a grid operator can impose — so a payback calculation never assumes production that, in practice, can't be fully exported to the grid.